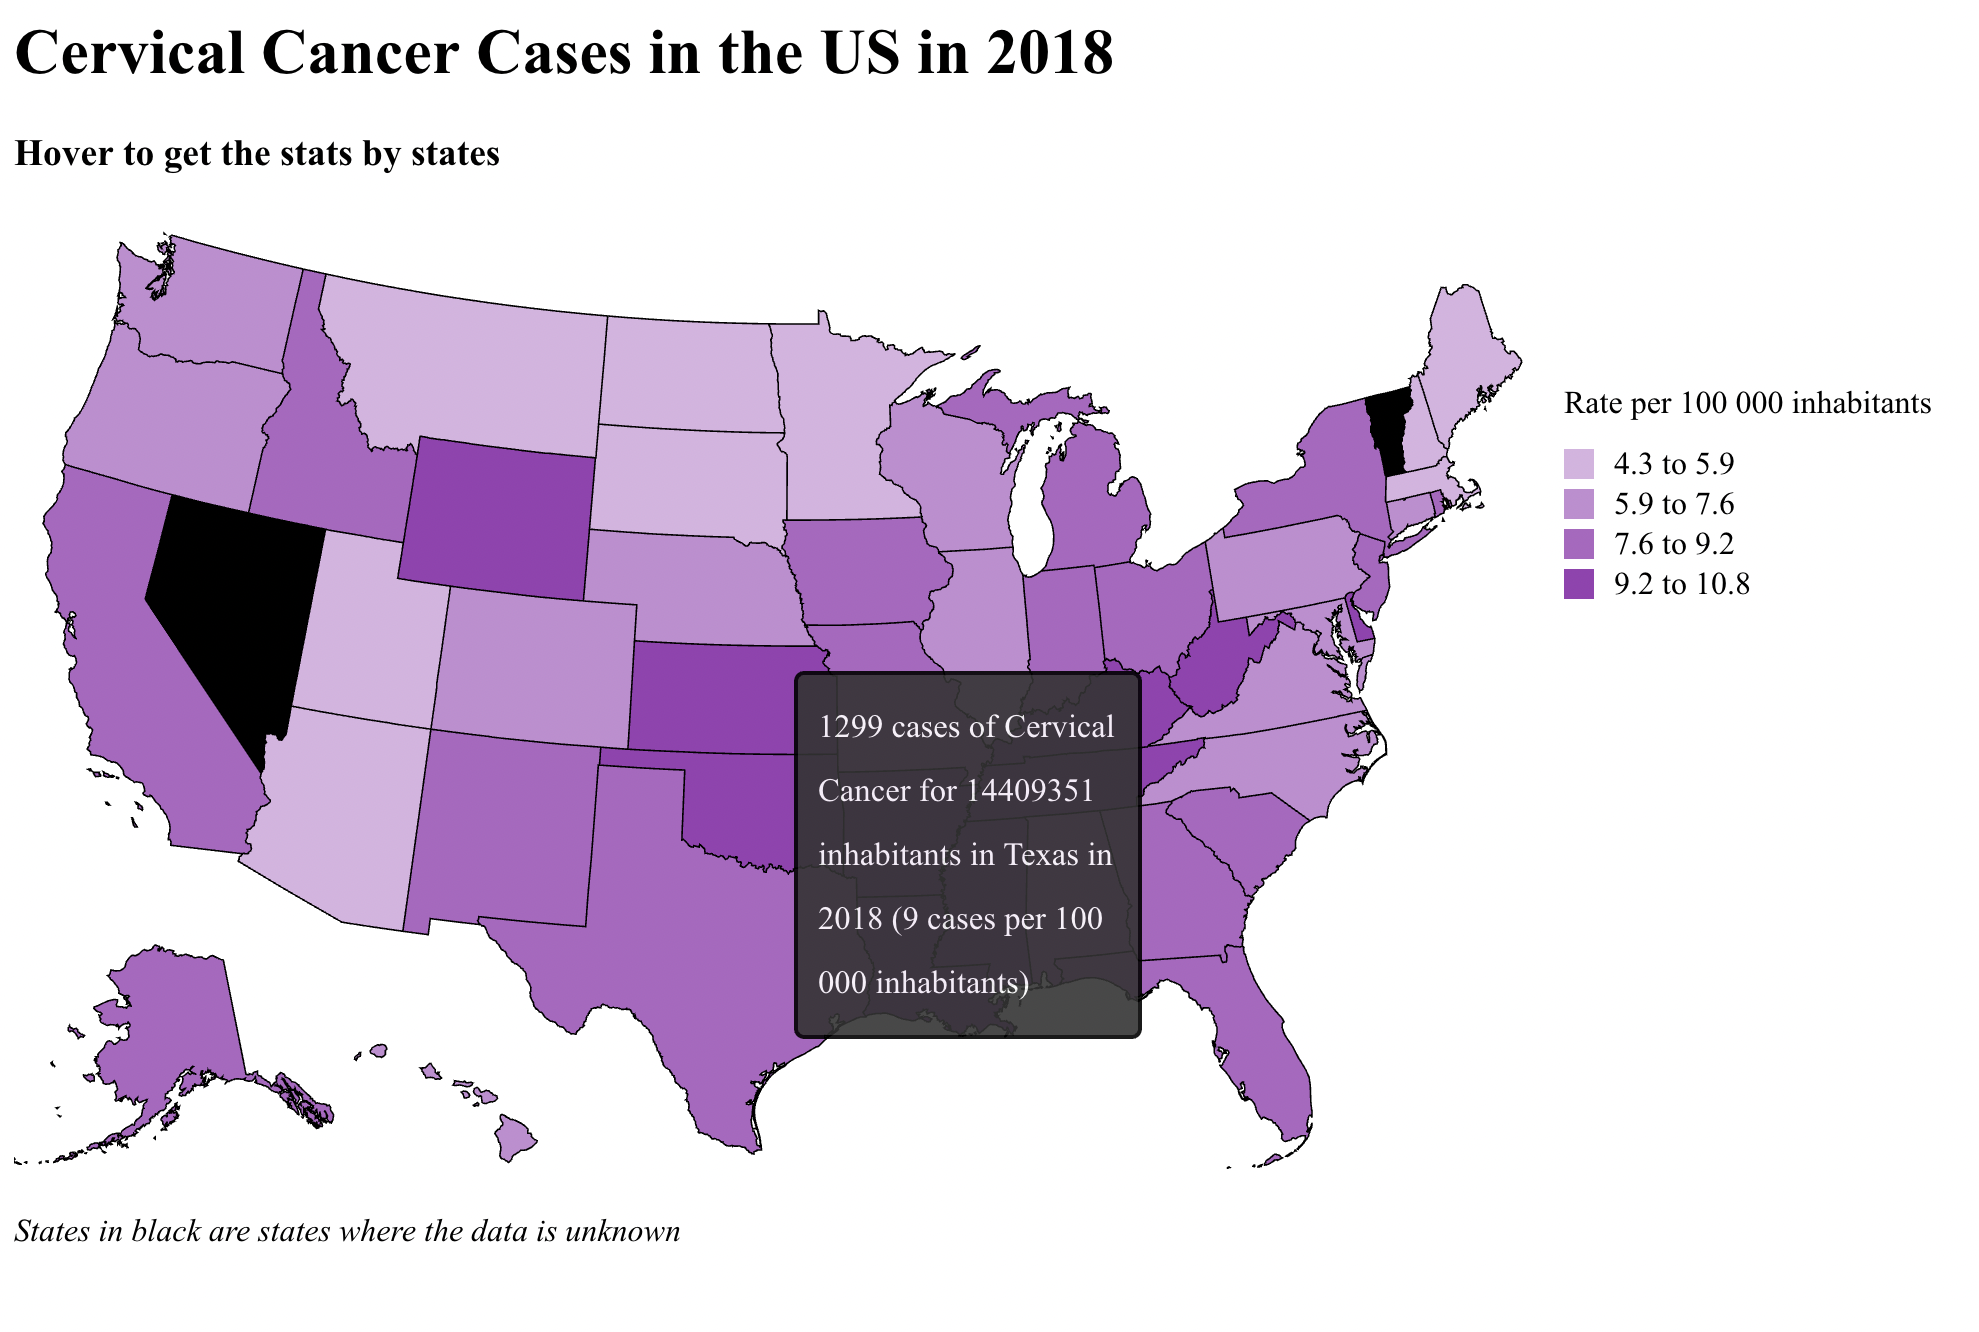
Chapter 6 Interactive component
6.1 Link to the interactive map
Click here or copy the url: https://vizhub.com/BenyaminLea/6b9ce5dd8942471d9a358dc1ae61d992?edit=files&file=index.html&mode=full
6.2 Description

The interactive part of our analysis was built with D3 version 6, which the code has been uploaded to vizhub.com. You can also find code here in our github repo. This map shows the number of cervical cancer by states in 2018 in the US. We used data from the CDC (Centers for Disease Control and Prevention). You can find the data here. It’s a different data set than the one used for the previous parts, this one gives a spatial point of view.You can get each state data by hovering each state on the map.